The Action is aimed at demonstrating the feasibility of integration of data collected in Actions B1 and B2 for mapping SFM indicators, at the spatial scales appropriate for the SFM decision-making, in the pilot areas. The focus of the activity is to test and evaluate methods coupling remote sensed information (LiDAR and multispectral data) collected from RPAS, with plot-level data, in order to derive: i) maps of selected Forest Europe SFM indicators; ii) a stratification of medium to large scale forest units by EFTs, so as to optimize the spatial estimation of SFM indicators.
Maps of the European Forest Types for the pilot study areas
The EFTs correspond to groups of ecologically distinct forest communities, dominated by specific assemblages of dominant trees (EEA, 20061; Barbati et al., 20142). The EFTs maps for the pilot study areas were derived by visual image interpretation, a qualitative image classification technique widely applied by forest practioners for forest cover typing. Differences in tone in the green band was the fundamental criterion for distinguishing tree dominant species. The high spatial resolution of RGB orthomosaic is fine enough that by a combination of tone, size, shape and texture criteria individual trees can be identified to genus or species by their branching habit and spectral response.
A common methodological setting finalized to EFT mapping was adopted for image interpretation:
- minimum mapping unit 0.5 ha, according to FAO-FRA forest definition (2005): forest is a land spanning more than 0.5 hectares with trees higher than 5 meters and a canopy cover of more than 10 percent.
- visual interpretation scale of 1:1500
- target EFTs classes to be mapped (based on prior knowledge of the EFTs classes occurring in the pilot test areas):
- 7.3 Apennine-Corsican mountainous beech forest
- 8.1 Downy oak forest
- 8.2 Turkey oak, Hungarian oak and Sessile oak forest
- 8.7 Chestnut forest
- 8.8 Other thermophilous deciduous forests
- 10.2 Mediterranean and Anatolian Black pine forest
- 13.2 Italian alder forest
- 14 Introduced tree species forest
- 99.2 Non forest
Based on these criteria three EFTs maps were produced for the pilot test areas of Caprarola, Bosco Pennataro, and Rincine. Here below an example of the map for the demonstration site of Rincine; more details and the EFT maps for all sites are provided in the deliverable “Maps of European Forest Types for the pilot study areas” present in the Pubblications page of the site.

Ground plot EFTs classification
In order to quantify how well the visual image interpretation worked in the different pilot test areas, ground truth data collected in fifty sampling units for each pilot study area, during Action B2, were processed to assign each plot with a EFT class. Sampling units size is 529 m2, corresponding to a square region of 230×230 10 cm2 pixels in the orthomosaic.
Dominant tree species at plot level was identified using relative basal area proportion. Two alternative approaches were tested to identify the forest species with the highest relative value of basal area in each plot:
- Relative basal area proportion out of total plot basal area
- Relative basal area proportion out of the basal area of the 5 trees with the largest diameter in the plot (dominant trees)
The rationale of using two different approaches for sampling units classification into EFTs is to evaluate whether differences in classification of reference data might appear when using dendrometric based (A) vs more forest cover based (B) criteria for the identification of the dominant tree species at plot level.
Accuracy assessment of EFTs maps
The accuracy of EFTs classification was assessed by four indices:
- Overall accuracy (OA) – OA quantifies the percentage of plots classified correctly according to ground plot based EFTs classification;
- Kappa index of agreement (KIA) – KIA reflects the difference between actual agreement and the agreement expected by chance; KIA = (OA-c)/(1-c) where c is the overall probability of random agreement. The use of KIA is especially relevant when some classes are more likely to be encountered during field sampling than others. Thus, some of the apparent classification accuracy given by OA measures could be due to chance, rather than to the ability of the photo-interpreter.
- Producer’s accuracy (PA) – PA quantifies how accurate is the map from the perspective of the producer; i.e. for a given mapped EFTs PA quantifies the percentage of plots that are labelled correctly on the map.
- User’s accuracy (UA) – UA classifies how accurate is the map from the perspective the user; i.e. number of plots correctly identified in a given map EFTs class out of the number of ground plots assigned to that map class;
In conclusion, findings from the visual interpretation of the RGB orthomosaic in the three study areas highlight that a high per-class thematic accuracy for forest type mapping (PA and OA>85%) can be achieved on a very fine spatial scale (minimum mapping unit=0.5 ha), even within forest areas with heterogeneous fine-scaled spatial pattern of tree dominant species (e.g. the test area of Rincine). For more details about the results of this first part of the action, please see the deliverable “Maps of European Forest Types for the pilot study areas” present in the Pubblications page of the site.
Segmentation and semi-automatic classification
A supervised classification method was also tested by segmentation and semi-automatic classification of true color orthomosaics (ground resolution 10 cm/pixel) as an alternative and more advanced approach with respect to the traditional visual image interpretation. Image data collected in the visible spectrum by the camera equipped on eBee was used. The map accuracy levels of products derived from segmentation and semi-automatic classification approaches were compared with those of maps derived by visual interpretation.
The multi-resolution segmentation and object-based image analysis of the orthomosaic was performed using eCognition software. Only pixels within the limits of the pilot study area were included in the analysis, in order to reduce data processing time.
Objects (polygons) were obtained by applying a fully automatic segmentation algorithm. Optimal parameters (scale factor, geometric/spectral homogeneity, compactness) for the segmentation were selected after iterative testing in each study area. As the forest types can be best discriminated by the reflectance in the green- wavelength region, the colour feature appeared as more relevant than shape related characteristics. However, the feasibility of forest types mapping by semi-automatic classification proved to be significantly constrained by the target classes to be mapped in each pilot study area (number, spectral differences among classes), by the image acquisition period (phenological differences between forest types classes) and by factors affecting the sensitivity of the image quality the orthomosaic. For more details about the methodology used in this part of the action, please take a look at the deliverable “Report on the technical and economic viability of using high spatial resolution optical data to stratify by EFTs medium- to large size forest management units” (present in the Pubblications page of the site), where all the parameters used for the segmentation and semi-automatic classification are provided and explained.
The classification of ground plots and the validation followed the same steps already exposed previously for the visual interpretation and the results obtained were compared in terms of timing and accuracy. Here below a table with the estimation of time to produce EFT classification using the two selected approaches, visual image classification and semi-automatic classification.

On the basis of our results, the following final remarks are provided:
- Visual interpretation resulted generally more accurate than semi-automatic classification;
- Semi-automatic classification required less time to be performed than visual image classification;
Semi-automatic classification of true color orthomosaics appears a feasible and economic (less time consuming) alternative to visual interpretation for mapping widespread EFT classes (beech and turkey oak dominated forest), provided that images are acquired by the RPAS under optimal conditions (different phonological status of the species, resulting in a diverse spectral response; absence of clouds; homogeneous light and atmospheric conditions between flights).
Maps of first SFM indicators
One of the tasks of Action B3 is testing and evaluating methods coupling remote sensed information collected from RPAS with plot-level data to derive, maps of Forest Europe’s SFM indicators: “Defoliation (# 2.3)”, “Forest damage (# 2.4)”, “Tree species composition (# 4.1)” and “Area covered by introduced tree species (# 4.4)”.
- Defoliation (# 2.3)
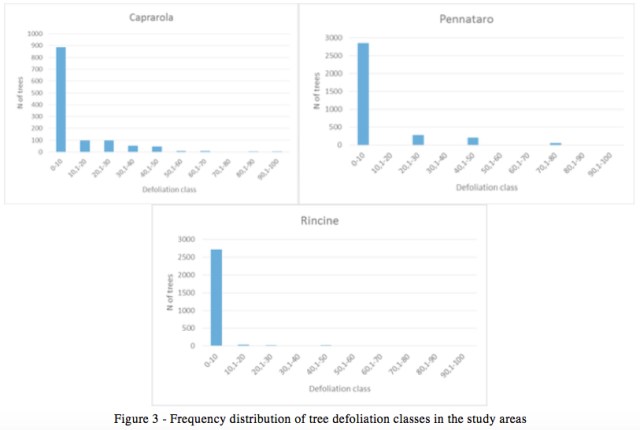
Forest Europe definition of SFM indicator 2.3 is «Defoliation of one or more main tree species on forest and other wooded land in each of the defoliation classes “moderate”, “severe” and “dead” ». This indicator is a proxy of tree health status and vitality, and it is usually monitored on field plots by visual assessment from the ground of tree crown condition. In our project, tree crown defoliation was one of the parameters collected during field sampling activities in action B2. Defoliation was estimated from visual assessment as needle/leaf loss in the assessable crown as compared to a reference (healthy) tree. Defoliation was assessed in 5% steps. Defoliation of 100 percent indicates dead trees. A summary of the relative frequency of defoliation classes observed in the study areas is shown in Figure 3. Tree crown defoliation is lower than 10% on most of the surveyed trees.
Considering the limited impact of defoliation in the study areas, we selected plots where trees with crown defoliation percentage is higher than 50% of the total tree crown, in order to verify whether such defoliation intensity is recognizable from the true color eBee orthomosaic. Crown defoliation was clearly detectable only on trees with severe damages, correspondent to trees with large parts of dead crown (70% to 99%), or on standing dead trees in the upper layer.
Based on this preliminary sensitivity check, the visual image interpretation of the RGB orthomosaic was targeted to mapping severely damaged and dead trees. We digitized all polygons of totally (defoliation class label=2) or partially (more than 70% defoliation class 1) defoliated crowns. The minimum mapping unit for delineating defoliation classes on individual trees was set ≥ 3 m2. This threshold was selected according to the minimum surface of totally defoliated crown, distinguishable on the orthomosaic (Fig. 4).
Accordingly, maps of the density of severely damaged and dead trees at the forest compartment level were produced for the pilot study areas. The highest class of defoliation density mapped at the forest compartment level is below 1 tree ha-1 in Caprarola and Pennataro and can reach nearly 7 trees ha-1 in Rincine.

- Forest damage (# 2.4)
Forest Europe definition of SFM indicator 2.4 is «Forest and other wooded land with damage, classified by primary damaging agent (abiotic, biotic and human induced)». Indicator 2.4 refers to the forest area damaged by abiotic (wildfires, storms, avalanches, etc) or biotic disturbances (e.g. insects and diseases). In the project pilot study areas forest damage occurred recently in Rincine case study only, due to a windstorm occurred in march 2015. The map of forest damage indicator for Rincine was derived by visual interpretation of true color orthomosaics (ground resolution 10 cm/pixel), with a minimum mapping unit 0,25 ha. Forest area affected by wind damage appear as clear felled areas in the orthomosaic (Figure 5), due to the salvage logging operations carried out after the storm event. The total forest area affected by wind damage in Rincine is however negligible, amounting to just above 3 ha.

- Tree species composition (# 4.1)
Forest Europe definition of SFM indicator 4.1 is «Area of forest and other wooded land classified by number of tree species occurring». The indicator is intended to monitor the area of forest that consists of one tree species alone or several tree species. The number of tree species indicator is generally quantified from field plot dbh measurements, by calculating the number of tree species exceeding the 5% of total plot basal area. There are of course some technical limitations to map the actual number of tree species in a given forest area from a classification of the eBee orthomosaic, due to the following reasons:
- some tree species are found only in the understory and do not reach the upper canopy layer;
- previous findings from the EFT mapping activity (cf. Deliverable B3 Maps of European Forest Types) proved that the spectral and spatial resolution of the eBee orthomosaic allows to feasibly distinguish by visual interpretation only the dominant tree species covering a given tract of forest land. In this regard, the visual classification proved to be more accurate than semi-automatic classification for forest cover typing (cf. Report on the technical and economic viability of using high resolution optical data to stratify by European Forest Types (EFTs) medium-to large size forest management units).
Considering these limitations, mapping the number of tree species occurring within a given forest compartment can be feasibly performed using the number of EFTs as a proxy (conservative estimate) of the number of tree species. Accordingly, the range of variability in the number of tree species occurring at the forest compartment level varies between 1 and 3 in Caprarola and Pennataro, and can reach 5 tree species in Rincine.
- Area covered by introduced tree species (# 4.4)
Forest Europe definition of SFM indicator 4.4 is «Area of forest and other wooded land dominated by introduced tree species». Introduced tree species are tree species occurring outside their natural vegetation zone, area or regions (also known as exotic or alien species). These areas are mapped under the class 14 Introduced tree species forest of the EFTs. In our case studies, forest areas covered by introduced tree species are found only in Rincine. These areas cover about the 25% of the pilot study area (70 ha ca) and are represented by reforestations with Douglas fir (Pseudotsuga menziesii) or other introduced conifers (e.g. Chamaecyparis lawsoniana). The minimum mapping unit for this indicator is the same as for EFTs maps (0,5 ha).
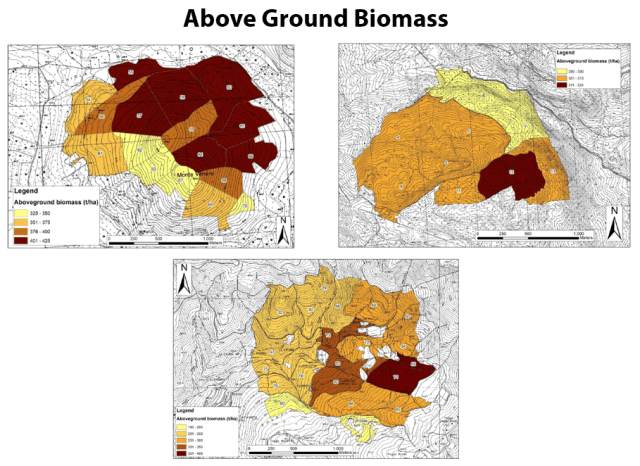
- Growing stock (# 1.3) and Above ground biomass (# 1.4)