The main aim of this action is to acquire new information in order to complete the ones collected in the Action B1 to form the entire dataset needed for the implementation of Action B3 (Mapping SFM indicators). On the basis of data needed for the achievement of Action B3, new field and remotely sensed data will be acquired. The final scope of this action is to complete the repository data with the acquisition of those data not yet available in study areas.
This action is divided into three main parts: assessment of collected data in Action B1, acquisition of new geospatial data, and acquisition of new field data.
Assessment of collected data in Action B1
The evaluation of the data acquired in Action B1 was carried out based on the requirements necessary to carry out the Action B3 (Mapping SFM indicators), in order to put the ones not available or not suitable in the list of the missing data.
For each demonstration site, the inventories data were evaluated according to the following criteria:
– type of survey;
– size of the sampling plots;
– selection method of the sampling plots;
– year of execution;
– precision of the geographical position of the center of the plots.
Acquisition of new field data
Concerning the acquisition of new inventory data, after the assessment of data collected in Action B1 with the creation of a list of missing data, we decided to create a new campaign of field surveys that will interest all the project’s demonstration sites. This need was already foreseen in the approved proposal in order to reduce the time gap between the field data and the new geospatial data.
In each site, 50 squared plots with sides of 23 meters (plot size = 529 m2) have been selected by UNIMOL in collaboration with UNITUS, two subcontractors (CREA and UNISI) and UNIFI using the one-per-stratum stratified sampling scheme (Brus et al., 1999; Barabesi et al., 2012). More details about the sampling scheme are described in the deliverable “Assessment of data collected from Action B1 and list of missing data” present in the Pubblications page of the site.
In each plot, all plants (trees and shrubs) with a dbh > 2.5 cm are inventoried. The spatial position of the inventory plot (x, y coordinates of the center of the plot) are acquired with GNSS receivers with a sub-meter accuracy. In order to standardize the collection of data in the plots, UNIMOL in collaboration with UNIFI and UNITUS prepared a common sampling protocol that describe in details all the field measurements in terms of methods and variables to be collected.
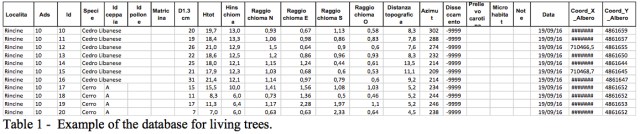
Fieldworks have been concluded in the sites of Rincine, Caprarola and Bosco Pennataro in November 2016. Fifty squared plots have been surveyed in each demonstration site; all the field measurements were carried out without any relevant problems. Between November 2015 and January 2016 all the data were evaluated and transcribed in a harmonized database (Table 1). For each demonstration site four spatial databases were created (living trees, stumps, standing deadwood, lying deadwood); for each surveyed element (trees, stumps and standind dead trees and lying deadwood) the spatial position within the plot was computed, and all the elements have been positioned in a Geographical Information System (Figure 1).

Acquisition of new geospatial data
We are acquiring both multispectral and laser scanning data for the study areas of Rincine, Caprarola and Bosco Pennataro. For multispectral data we are using two sensors (RGB and NIR cameras) carried by the fixed wing RPAS “eBee”, which has been purchased by the UNIFI specifically for the purposes of the project. For laser scanning data we are using a Lidar sensor carried by helicopter (Octocopter) RPAS developed by the beneficiary partner Oben. More details about the characteristic of the two RPAS are described in the deliverable “Assessment of data collected from Action B1 and list of missing data” present in the Pubblications page of the site.
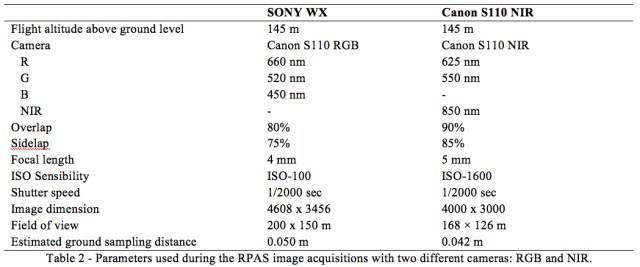
Regarding the multispectral data, 12 ground control points (GCP) were placed in each area before RPAS acquisition using 50×50 cm targets; the x,y coordinates of each GCP were registered by a global navigation satellite systems (GNSS) using a Trimble Juno 3B Handheld receiver observing the pseudorange of both GPS and GLONASS. Data collection lasted for approximately 10 minutes for each GCP with a 1-sec logging rate. SenseFly eBee fixed-wing RPAS was used for multispectral data acquisition. The RPAS weighs approximately 537 g without payload and has a maximum flight time of 45 minutes under optimal weather conditions. The eBee is equipped with an onboard GNSS to provide rough positioning. In this project the eBee was equipped with two cameras: a Canon S110 near infra-red (NIR) camera and a SONY WX RGB camera as the payload. The sensor produces two types of images: Canon S110 NIR takes pictures of 12.1-megapixel in the green (550 nm), red (625 nm), and NIR (850 nm) wavelengths, while the SONY WX takes pictures of 18.2 MP in the red (660 nm) green (520 nm) and blue (450 nm) wavelengths.
The flight parameters used in the three demonstration areas were the same and are summarized in Table 2.
Software eMotion 2 version 2.4.2 was used to simulate, to plan and to monitor the flight. The total acquisition area was 1298 ha with a total of 23h40’ of flights.
In the site of Caprarola, the eBee acquisition was done between May 23th and May 27th, 2016. Two days were needed to measure GCP, while two days were needed to acquire the multispectral data. To cover the entire area, 5 RGB flights (483 images) and 5 NIR flights (564 images) were done, respectively.
In the site of Bosco Pennataro, the eBee the acquisition was done between June 26th and June 30th, 2016. Also in this area two days were used to measure GCP and 2 days were needed to acquire the multispectral data. To cover the entire area, 6 RGB flights (608 images) and 7 NIR flights (689 images) were necessary, respectively.
In the site of Rincine, eBee acquisition was done between July 26th and July 29th, 2016. Two days were used to measure GCP, and two days were needed to acquire the multispectral data. To cover all the study area, 4 RGB (506 images) and 5 NIR (682) flights were needed, respectively.
A summary of the flights carried out by eBee drone is reported in Table 3.

The block of images were processed for each area and each sensor. The RPAS images were processed using the Agisoft PhotoScan (Agisoft LLC, 2017) to create a 3D point cloud. Agisoft Photoscan combines SfM (Structure from Motion) and photogrammetric algorithms for 3D reconstruction from unorder but overlapping imagery. This software was chosen as previously found to be suitable for forest applications. Photoscan offers a user-friendly processing pipeline that combines proprietary algorithms from computer vision SfM and stereo-matching algorithms to accomplish the tasks of image alignment and multiview stereo-reconstruction. Image alignment consisted of the sparse reconstruction of 3D geometry by detecting and matching image feature points in overlapping images using SfM techniques. The estimation and optimization of the camera orientation and internal parameters are the main outputs of this stage. Consequently, GCPs were used to improve the estimates of camera position and orientation, allowing for more accurate model reconstruction. Their coordinates were imported and placed using a guided approach. After the optimization of camera position the dense point cloud and a Digital Surface Model (DSM) were computed by Agisoft Photoscan. The DSM were than used to Ortorectify the RPAS images. A summary of the parameters used in Agisoft Photoscan to process RPAS images is shown in Table 4. The results of the images process produced the following remote sensing products for each area: two dense point clouds (NIR and RGB) (ranging between 20-40 point m2), two DSMs (50 cm resolution) and two ortophotos (RGB and NIR 10 cm resolution).

Regarding the new LIDAR data, the acquisition was almost completed in the demonstration sites of Rincine and Bosco Pennataro. The LIDAR sensor was carried by the octocopter, which is the drone developed by the beneficiary partner OBEN. However, because of the changes introduced by ENAC in the national drone flight regulation, which has limited the use of this platforms, in particular by forbidding any operation beyond what can be done in constant visual contact of the pilot with the drone, and in any case within a short distance (500 m) from the pilot position, we were able to fly with octocopter over 75% of the total area of the demonstration sites; in the remaining 25% of the area it was not possible to fly with drone since some areas are mostly unavailable in the central part or in relatively deep valleys far from the clearings suitable for piloting. For this reason and in order to get the LIDAR data for the entire study areas, we used a light helicopter instead of the octocopter as platform to fly with LIDAR sensor over inaccessible areas. It is worth of noting that the light helicopter has technical characteristics (e.g., flight profile, flight altitude above canopy top, flight speed) which allow to emulate very well the flight of a drone as already experienced by OBEN in various situations in which it used the light helicopter to overcome regulatory limitations. This solution has been found suitable to solve the problem without any need for amendments in project budget. and permits full demonstration of the capabilities of the sensor carried by the drone, in view of the new regulations that will soon permit drone flights also beyond visual line of sight. Indeed, with a higher productivity per hour, the impact of the rental of the light helicopter is entirely sustainable within the budget already envisaged. A summary of the flights carried out by both octocopter drone and the light helicopter is provided in the Tables below.

The pre-processing of the LIDAR data was performed by OBEN using Cloud compare and Terrascan softwares. The results of the LIDAR processing provided the following remote sensing products for each area: a dense point cloud (ranging between 70-120 point/m2), a Digital Terrain Model (DTM) with a spatial resolution of 50 cm, a DSM with a spatial resolution of 25-50 cm, and a Canopy Height Model (CHM) with a spatial resolution of 50 cm. In addition, a data quality check of the LIDAR products was performed by OBEN in the site of Rincine; this check was possible thanks to the availability of a LIDAR data taken in 2015 over the area of Rincine, which was acquired as existing data in Action B1.